f_max
-
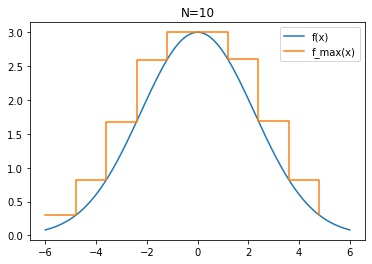
stats.f_max(xs, ys, N)¶ maximun value ys in N intervals
- Parameters
xs (np.array) – x values
ys (np.array) – y values
N (int) – number of interval in the x range
- Returns
x_values (np.array) – interval values for x (size = N+1)
y_max_values (np.array) – max of y on each interval (size = N)
Examples
>>> import numpy as np
>>> import matplotlib.pyplot as plt
>>> import qilum.stats as qs
>>> # input
>>> xs = np.linspace(-6,6, 1001)
>>> ys = 3.*np.exp(-np.square(xs)/10.)
>>>
>>> # calcul
>>> xs_inter, ys_inter = qs.f_max(xs, ys, 10)
>>>
>>> # plot
>>> plt.plot(xs, ys, label='f(x)')
>>> plt.step(xs_inter[:-1], ys_inter, where='post',label='f_max(x)')
>>> plt.title('N=10')
>>> plt.legend()
>>> plt.show()